Gold, Silver and PGM Price Floors Hold Up Against Headwinds
The precious metals complex is proving resilient in the face of intensifying macroeconomic headwinds and ongoing uncertainty over the direction of the conflict in the Middle East.
Prices for gold, silver, platinum and palladium fell below key psychological levels this week on the back of hawkish interest rate signals for this year and next, as well as surging treasury yields and a stronger greenback. At the same time, the back and forth between the US and Iran has added another layer of push-and-pull forces.
Even so, all four metals are still demonstrating a strong ability to recover as supply and demand fundamentals provide stable floors of support. The proof will be in the second half of the year as key catalysts come into play.
Let’s take a look at what’s got the precious metals moving over the past week.
Gold price news
The worsening macro picture pressured gold below the key US$4,500 per ounce mark this week.
The yellow metal slid from a close of US$4,543.20 on May 21 to an intraday low of US$4,492.79 the morning of May 22. Gold barely managed to close above the US$4,500 level that day.
The retreat came as the market digested expectations of increased rates — CME Group’s (NASDAQ:CME) FedWatch tool now shows a 44.4 percent chance of a December increase, up from just 1 percent a month ago.
Higher rates raise the opportunity cost of holding non-yielding assets such as gold.
Monday (May 25) saw a brief bounce for gold as the price jumped to an intraday high of US$4,577.16 in the morning; it then scaled back slightly to close at US$4,570.38. The rebound was based upon fleeting market optimism about a potential end to the Iran war and a reopening of the Strait of Hormuz.
Given the US Memorial Day holiday, the price stayed in a very narrow trading range.
The next day was the start of a steeper gold decline as reality sank in that higher energy prices are likely here for longer. The precious metal sank as low as US$4,483.38 by midday before a close of US$4,507.48.
On Wednesday (May 27), the selloff accelerated in early morning trade, taking gold to a two month low of US$4,401.87 as the persistent threat of inflation fueled expectations that central banks will maintain tighter monetary policy for longer. The metal had a minor bounce on bargain hunting and closed out the day at US$4,4546.43.
Gold retreated even further during Thursday’s (May 28) early morning session to as low as US$4,378.09. However, once again the potential for a peace deal between the US and Iran gave gold a reprieve.
By 10:00 a.m. PDT that day, gold had bounced back up to US$4,511.10, nearly on par from the same time last Thursday despite the ongoing macro headwinds generated by the Iran war.
Gold was down more than 19 percent from the US$5,589.38 all-time high reached on January 28.
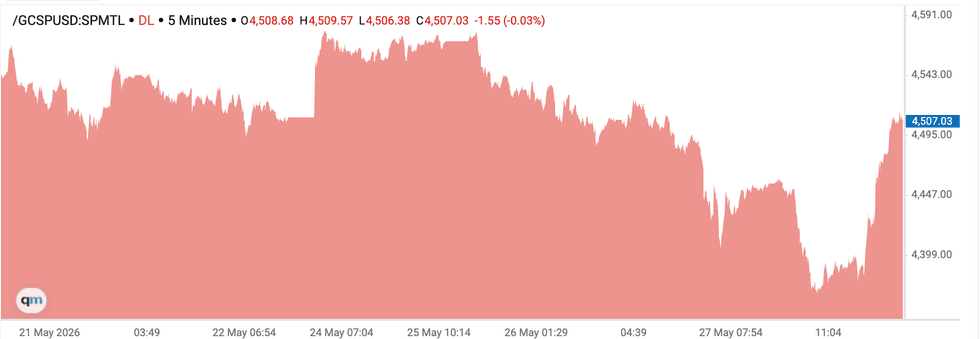
Chart via the Investing News Network.
Gold price chart, May 21 to 28, 2026.
What direction could gold take in the coming weeks? Here are the gold price’s potential near-term catalysts:
- June 5 — Nonfarm payrolls will help gauge the health of the US labor market.
- June 10 to 11 — May consumer price index (CPI) and producer price index (PPI) data releases out of the US will show if inflation is still ticking upward.
- June 16 to 17 — The US Federal Reserve will hold its next meeting. This will be the inaugural session for Kevin Warsh, the new chair. He and the rest of the board will need to grapple with recent sticky CPI and PPI. Hiking rates or holding them steady could place downward pressure on gold.
For more insight into what’s moving thegold market check out the Investing News Network’s recent interviews:
- Rick Rule: Gold, Silver, Oil, Uranium — Price Triggers, My Strategy Now
- Stephen Leeb: Gold Price to US$18,000? Here’s How it Can Happen
In gold-mining news, mid-tier producer Minera Alamos (TSXV:MAI,OTCQX:MAIFF) reported record quarterly revenue of US$39.2 million, record earnings from mine operations of $19.5 million, record net earnings of $10.9 million and EBITDA of US$15.3 million for the year’s first quarter.
Silver price news
Silver price chart, May 7 to May 14, 2026.
Silver tracked gold’s performance this week, but without the same volatility.
Much like the previous week, the white metal managed to retain key support zones near the US$74 to US$75 per ounce level, demonstrating that the white metal’s steady industrial demand is holding the floor.
On May 21, silver closed at US$76.60 before falling to a low of US$75.35 in the morning session the following day.
Silver experienced a relief spike on Monday, moving up toward US$78.49 in the morning as rumors circulated that peace talks could lead to the reopening of the Strait of Hormuz. The metal closed at US$78.07.
Those gains quickly evaporated, and silver tumbled to a low of US$75.52 in early morning trading on Tuesday (May 26) as the same monetary policy pressures hurting gold took a bite out of its sister metal.
Despite a run to an intraday high of US$77.05, silver closed the session out at US$76.96.
Wednesday saw silver take further hits. It fell sharply to as low as US$73.46 in morning trade before closing at US$74.64. Thursday morning saw silver fall as low as US$72.81 early on. By 10:00 a.m. PDT on Thursday, the silver price had rebounded to US$75.80, only about 0.29 percent lower than the same time last week. However, its value is still down more than 37 percent from its all-time high of US$121.62, which it set on January 29.
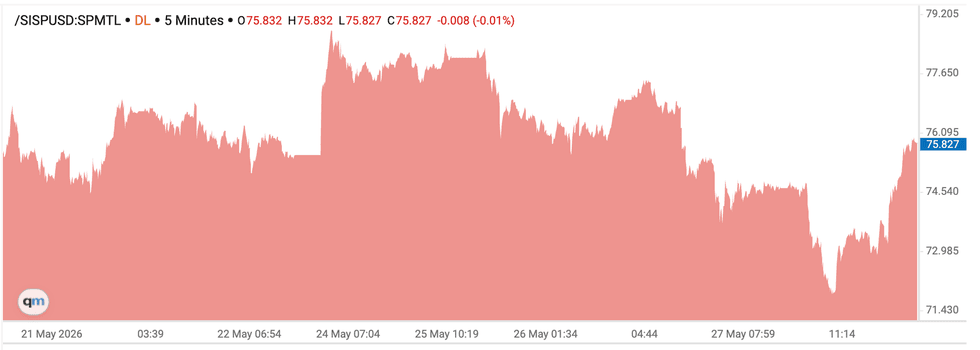
Chart via the Investing News Network.
Silver price chart, May 21 to 28, 2026.
Here’s a look at thesilver markets potential near-term catalysts on top of those influencing gold:
- The end of May will be the first notice day for June Comex silver futures. With silver heading for its sixth consecutive annual supply deficit, institutional buyers demanding physical delivery rather than cash settlement could quickly eat up Comex vault inventories, resulting in a physical liquidity squeeze.
- In early June, Global Manufacturing Purchasing Managers’ Index data will be released from not only the US, but also the Eurozone and China. Physical silver is used by many industries in these regions, especially in solar panels, electronics and automotive applications.
- Additionally, artificial intelligence (AI) infrastructure and data center reports from major tech firms regarding infrastructure expansion could act as a silver-specific catalyst. The metal is essential for the high-conductivity components used in AI data centers.
In silver-mining news, Avino Silver & Gold Mines (TSX:ASM,NYSEAMERICAN:ASM) reported higher Q1 operating revenue and mine operating income, boosted by robust metal prices earlier in the spring.
The company posted a record US$39.4 million in revenue (up 109 percent from Q1 2025), record mine operating income of US$23.4 million (up 122 percent) and EBITDA of US$25.5 million (up 163 percent).
Platinum price news
Platinum followed the broader precious metals complex downward this week on heavy selling pressure. Like silver, platinum is both a precious metal and a critical industrial material.
However, platinum took a harder hit than its sister metal. The metal’s price was down more than 1.9 percent over the period, and well off its January all-time high near US$2,924 per ounce.
On Monday, the platinum price did rise as high as US$1,981.50, but it traded mostly sideways in the US$1,970 range. After recording a morning low of US$1,943.20, platinum got a momentary boost on Tuesday from supply concerns; it was able to close at US$1,967.60 that day. However, platinum sank once again on Wednesday to an intraday low of US$1,911.80 in the morning session before achieving a close of US$1,930.90.
As of 10:00 a.m. PDT on Thursday, platinum was trading at US$1,929.50.
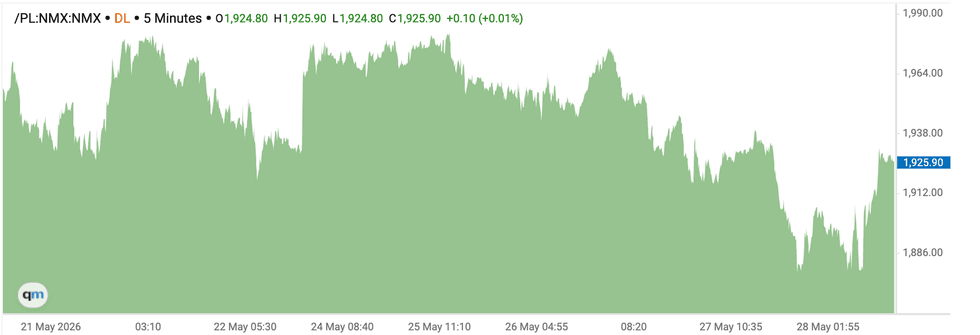
Chart via the Investing News Network.
Platinum price chart, May 21 to 28, 2026.
As for potential near-term catalysts for platinum, those on the horizon for gold and silver are also at play. Here are a few other key events that could influence the direction of the platinum price:
- For June, automotive manufacturing data and monthly vehicle registration reports will be released by major auto associations such as China’s CAAM and Europe’s ACEA.
- June will also bring the potential for further platinum mine supply disruptions out of South Africa, which produces roughly 70 percent of the world’s primary platinum supply. The country’s winter season begins in June, placing strain on an already fragile electrical grid. At the same time, several major platinum mine labor unions are scheduled to begin preliminary wage negotiations.
In other platinum news, China’s Guangzhou Futures Exchange announced it is exploring the launch of night trading sessions for platinum and palladium. That could significantly alter physical liquidity and trading volumes.
Palladium price news
The palladium price dropped beneath the psychological US$1,400 per ounce floor this past week, driven by the same broad macro pivot toward “higher-for-longer” rates, a surging US dollar and safe-haven liquidations.
Palladium closed at US$1,400 on May 21, and fell as low as US$1,367 the next day; the metal was aggressively sold alongside other non-yielding assets as the likelihood of higher rates became stronger. It closed at US$1,379.
A severe supply deficit checked the downward technical momentum as industrial buyers stepped in to stabilize prices, taking palladium back up to the US$1,415 to US$1,425 range on Monday and Tuesday. Palladium followed the precious metals complex further down on Wednesday, dropping below the US$1,400 level in the early morning and falling as low as US$1,397.50. The metal still managed to close out the day at US$1,416.
On Thursday, palladium slipped as low as US$1,353 before recovering to US$1,396 as of 10:00 a.m. PDT.
The palladium price was up a marginal 0.65 percent over the same time last week, but was trading at only about a third of its March 2022 all-time high near US$3,440.
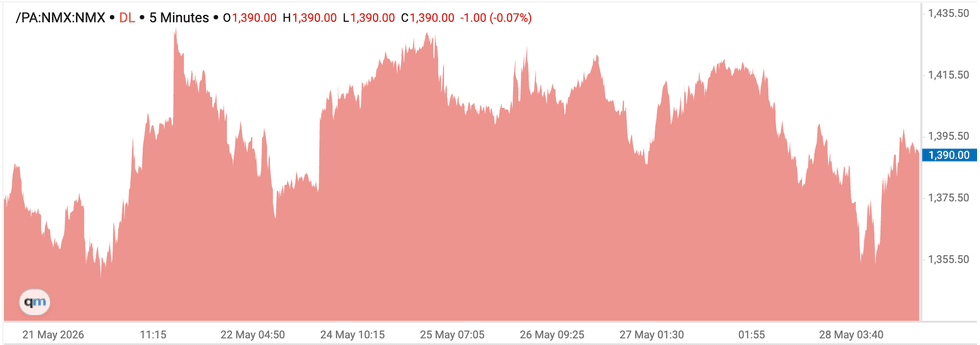
Chart via the Investing News Network.
Platinum price chart, May 21 to 28, 2026.
Unlike gold, silver and platinum, palladium is an overwhelmingly industrial metal, with roughly 85 percent of its total supply going toward the automotive sector. For that reason, its price activity over the next month will be heavily driven by sector-specific catalysts similar to the ones mentioned above for palladium.
Looking deeper, the final US International Trade Commission determination on Russian palladium imports, which could result in legal enforcement action, is concluding by early July.
Russia’s Norilsk Nickel is the single largest palladium producer in the world, so the ruling could permanently lock in triple-digit tariffs and block Russian palladium from western supply chains. North American auto manufacturers could be scrambling to secure replacement metal on the spot market.